Features
Production
Research
Taking toys and putting them to work
Discovering and developing a role for UAV’s in Canada’s fruit and vegetable industry
June 12, 2018 By Tom Walker
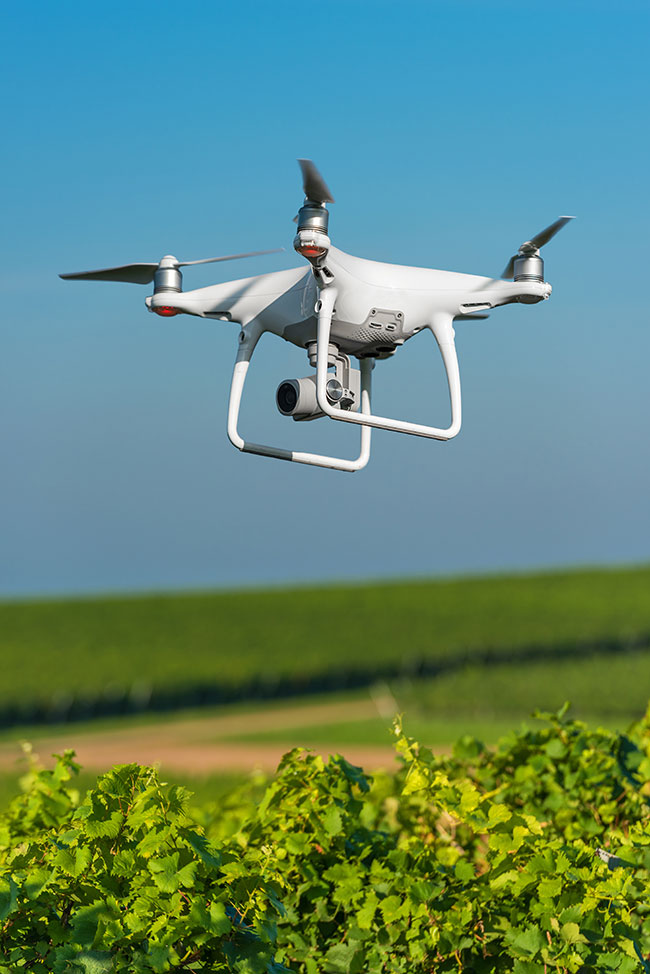
 The various types of images that can be captured from a UAV are able to provide a range of data that can improve the precision of a fruit and/or vegetable grower’s operation. Photo: Fotolia
It would be nice to be able to stand up and look out over your whole field at once, with a “bird’s eye view, to see how it is progressing. A camera mounted on an Unmanned Aerial Vehicle [UAV or drone] can do that for you.
The various types of images that can be captured from a UAV are able to provide a range of data that can improve the precision of a fruit and/or vegetable grower’s operation.
“It’s a quick and easy way of looking at your field,” explains Tom Elliot. An agrologist and principal with Madrone Environmental Services, Elliot was speaking about UAV use at the Pacific Agriculture show in January. “UAVs are rapidly transitioning from recreational to industrial uses.”
UAVs provide a data collection platform that can be deployed on mass to help famers make management decisions.
“It’s just like any other data collection tool.” Elliot says. “You have to consider if you will get a return on your investment.”
With the increasing need to achieve maximum potential yield from a field, UAV collected imagery may help a farmer with tools to reach that goal.
“Being precise about your inputs is becoming more critical in agriculture,” says Eliot. “That is particularly true in the B.C. Fraser Valley where the cost of land is so high.”
A farmer must first identify the gaps in his information, says Elliot.
“What is it that you want to know about your operation,” he asks. “Then, how, and with what imaging tools will you gather that information, and how will you interpret the data to support the better management of your crop?”
Currently, the imagery gathered from a UAV can provide a farmer with descriptive and diagnostic tools and data managers are working toward predictive formulas to estimate irrigation and nutrient requirements and potential yield.
The various types of images that can be captured from a UAV are able to provide a range of data that can improve the precision of a fruit and/or vegetable grower’s operation.
There are four commonly employed data technologies that can each provide a different range of information to a grower.
The first is a high quality colour photograph. Sometimes referred to as RGB, (Red Green Blue) the high-resolution photos represent what the human eye would see from a plane. They allow the farmer to observe the layout and status of his crop, and check infrastructure and easements. Planting density, leaf-out or growth progress can also be noted, as well as any planting gaps that need to be addressed. Photos are of limited value for detecting areas of plant stress, unless it is severe [typically beyond rescue] and work best when a crop is at full canopy. It is not a good tool for showing variances in plant vigour.
Near Infrared Imagery, or NIR, detects the reflection of a specific type of light from chlorophyll within plant cells. It displays information that would normally be invisible to the human eye. An NIR image [or map] typically shows areas of highly vigorous crops in bright red, and weak crops or bare soil in gray to blue tones. NIR helps data managers identify areas of plant stress that could be the result of nutrient management, water management, plant disease, or pests.
That NIR data can be further refined into a Normalized Difference Vegetation Index, or NDVI, to produce an NDVI map, which shows crop vigour with a much higher differentiation. NDVI images display a range of crop variation even if an entire field is relatively strong, or relatively poor. NDVI maps are typically displayed as the inverse of an NIR image. Green areas show high crop vigor, while red is low.
Both of these image types can identify areas of “need” in a crop field, and experienced data interpreters with a background on the crop can begin to diagnose a problem [for example, how the difference between water stress and pest stress is presented in the imagery]. However, they are not a substitute for boots on the ground to investigate and prove the cause of the lack of vigor that the images are showing.
“Think of UAV imagery as a trouble shooting map,” says Elliot. “It guides you to areas that need more attention in order to optimize results, but would otherwise have gone unnoticed until some degree of crop loss occurred.”
Thermal images from a UAV provide a fourth data set of use in a farming operation. Thermal images measure the heat emitted from all objects and will allow you to identify soil moisture differences, and even the integrity of under ground irrigation systems, as well as aid in water demand and evapotranspiration calculations.
“This is all important information as water use efficiency is becoming an important part of farming,” notes Elliot.
A further consideration is the timing and frequency of the data collection. Do you wish to check your field after planting has been established to see where there are gaps that may need over-seeding? Later on in the season, do you wish to re-check for vigour to clarify if a nutrient adjustment has made a difference? Or after a hot dry spell, do want to look for stressed plants, particularly in a zone of porous, sandy, soil that may not retain much moisture from irrigation.
“The ease and speed of UAV data collection allows you to monitor more frequently and over time to track changes in your field,” Elliot explains.
Cranberry fields are not great places to walk, but they make ideal candidates for UAV monitoring. Elliot recalls work with a cranberry grower in Delta, B.C. The fields were suffering from loss of vitality leading to low production. The grower was looking to identify specific areas of his fields to target soil and nutrient remediation. Using a combination of thermal and vegetation index imagery, Elliot was able to pinpoint specific areas for a change in nutrient application and areas that needed greater rehabilitation of the soil and replanting.
Print this page