Features
Fruit
Production
New Ont. fire blight risk prediction maps for 2017
May 9, 2017 By Michael Celetti OMAFRA
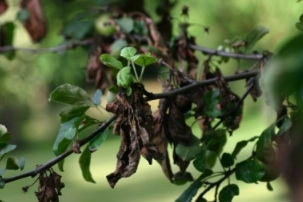
May 9, 2017, Guelph, Ont – The Ontario Ministry of Agriculture, Food and Rural Affairs is again developing fire blight risk maps during the 2017 apple and pear blossom period based on the Cougarblight Model to help support apple and pear growers with their fire blight management decisions.
The risk is based on inputting the seven-day weather forecasts from 67 locations from various regions throughout the province into the Cougarblight model. The results from Cougarblight are then mapped and posted on the OMAFRA Website.
This year, there will be a separate webpage for apples and pears (in English and French).
The maps are animated and will cycle through the seven-day fire blight risk predictions based on the seven-day weather forecast. Updated fire blight risk prediction maps will be generated and posted three times per week (Monday, Wednesday and Friday) until bloom period is over. A new feature on the maps will allow growers to zoom in and out of the maps, reposition them to their specific locations and pause or start the maps.
As with any model, the fire blight risk is a general guide and environmental conditions may be more conducive for fire blight infection in a particular orchard than what is indicated by the maps. All apple and pear growers are encouraged to run either the Cougarblight or Maryblyt model with data generated from their orchards for a more accurate prediction.
Assumptions: The risk assumes that open blossoms are present and dew or rain will wet the blossom, which is necessary for a fire blight infection to occur. If there are no open blossoms or if wetting of the open blossoms does not occurs, infection will most likely not take place. However, it only takes a little dew to wash the fire blight bacteria into the open blossom for infection to occur.
How to use the maps: There are only two maps that will be generated this year, one for ‘fire blight occurred in the neighbourhood last year’ and another for ‘Fire blight occurred in the orchard last year and is now active in your neighbourhood’. To use the maps, orchards must be assigned to one of two categories based on the fire blight situation in the orchard last year and this year.
- Fire blight occurred in the orchard last year and is now active in your neighbourhood (use the 1st map labeled ‘Active Fire Blight in Apples 2017’)
- Fire blight occurred in the neighbourhood last year (use the 2nd map labeled ‘Fire Blight Occurred Last Year in Apples’)
If the fire blight situation from last year is not known, it is best to assign the orchard to ‘Fire blight occurred in the neighbourhood last year’ and follow the 2nd map on the webpage. Once the orchard has been assigned to one of the categories above, locate the region of the orchard on the fire blight risk prediction maps and follow the animated maps for the predicted fire blight risk corresponding to the dates on the map. The animated maps will change through the changing risks over the seven day forecast, so watch them carefully. A brief interpretation of the risk will be posted above the maps for each update.
Interpretation of Risk: The following risks (Legend) are colour coded on the maps and designated as follows:
- Low (green): Indicates a low risk of fire blight occurring. Wetting of blossoms during these temperature conditions has not resulted in new infections in past years.
- Caution (orange): Wetting of flowers under these temperature conditions is not likely to lead to infection except for blossoms within a few meters of an active canker. Risk of infection will increase if the weather becomes warmer and wetter. Weather forecasts should be carefully monitored. If antibiotic materials are not being used, blossom protection with other materials should be initiated one or two days prior to entering a high infection risk period. Continue appropriate protective sprays until the infection risk drops below the “high” threshold.
- High (purple): Under these temperature conditions, serious outbreaks of fire blight have occurred. Orchards that recently had blight are especially vulnerable. The risk of severe damage from infection increases during the later days of the primary bloom period, and during petal fall, while blossoms are plentiful. Infection is common, but more scattered when late blossoms are wetted during high-risk periods. The potential severity of infection increases if a series of high-risk days occur.
- Extreme and Exceptional (magenta): Some of the most damaging fire blight epidemics have occurred under these optimum temperature conditions, followed by blossom wetting. Orchards that have never had fire blight are also at risk under these conditions. Infections during these conditions often lead to severe orchard damage, especially during primary bloom or when numerous secondary blossoms are present.
Print this page