Features
Ethnocultural Vegetables in Canada Part I
Resource Guides
Customer Analysis
October 6, 2016 By Fruit & Vegetable
Customer Demographics
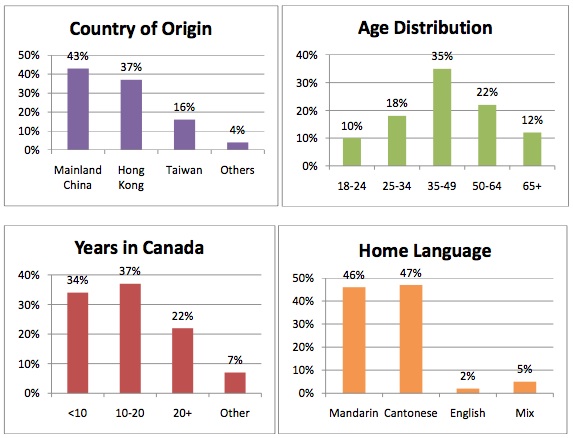
Chinese Canadian demographics are outlines in the charts below. Highlights are as follows (Ipsos Reid, 2007):
- The most common country of origin is mainland China (43%)
- 63% of Chinese Canadians are under the age of 50
- Cantonese is the most commonly spoken language at home (47%)
- The most common range of years spent in Canada is 10-37 (37%)
 |
|
|
Income and spending
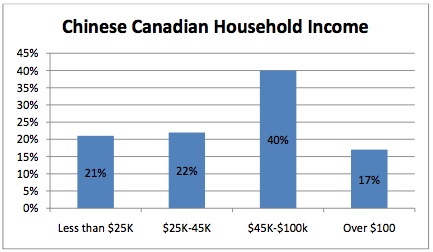
A conclusion drawn from an Ipsos Reid study on Ethnic marketing in Canada was the Chinese and South Asian Canadians have significant purchasing power. The household incomes for Chinese Canadians can be seen in the chart below, with 57% earning more than $45k per year (Ipsos Reid, 2007). In additon to this, 48% of Chinese Canadians have investable assets of $50k + Compared to 36% of mainstream Canadians (Jimmintz, 2008).
 |
|
|
Further, 54% of South Asian Canadian households have an income of more than $60k per year, which is significantly higher than mainstream Canadians of whom 46% have a household income of over $60k (Jimmintz, 2008).
In addition to having higher than average household incomes, these consumers also spend more money on their groceries. A study by Solutions Research group indicated that “Chinese Canadians spend C$136 on groceries weekly, 9% more than the average shopper in Toronto and Vancouver, and that South Asian Canadians spend 23% more than the average,” (Euromonitor International, 2011).
Print this page